
Statistics
The statistics section clearly shows the dynamics of all key business indicators — revenue, number of customers, repeat purchases, and loyalty program activity.
What it offers your business
Indicator dynamics
Track revenue and activity growth over time — by day, week, and month.
Customers and return visits
See how many new customers you've gained and how often they return to shop.
Data for decisions
Clear numbers instead of guesswork — make decisions based on real indicators.
Customer engagement
The statistics section shows how customer engagement in the loyalty program changes — over any period.
Noticed a decline? That's a good reason to support the program with a promotion.
All statistics on your phone
You can track the numbers not only from a computer: the UDS Business mobile app shows a daily summary on the home screen — financial figures, how many customers there were and how many transactions were made.
The "Statistics" section (icon in the top right corner of the home screen) has two blocks:
- By transactions: orders, purchases, turnover and revenue for a period from one day to a year or for all time, with filters by branch, status, and transaction type.
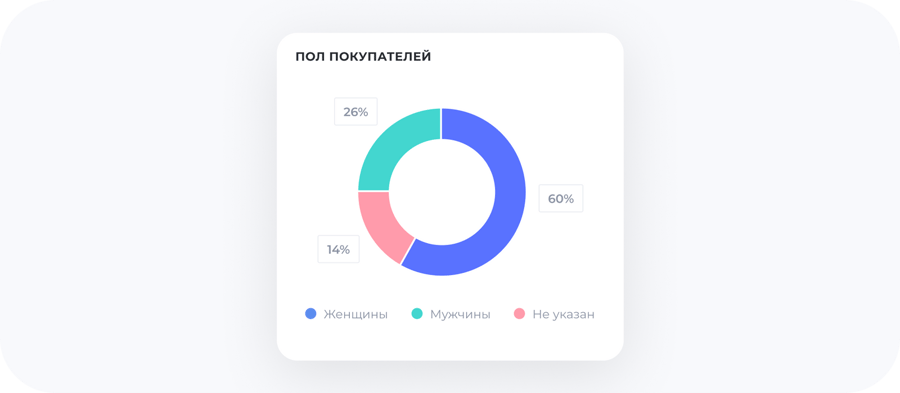
- By customers: buyers' gender and age, turnover from them and average check, also with filters.
Monthly UDS results report
Once a month, the UDS Business Mobile app compiles a summary of your company and presents it with charts and graphs: savings on discounts, referral program revenue, average number of purchases per digitized customer, and costs that were avoided. The report also shows the total benefit for the entire time working with the platform.
Counters and customer profile
The "Statistics" section shows how many of your customers are digitized in UDS, how many of them became buyers, and how many purchases there are on average per buyer. The "Customers" tab shows gender and age — so you can build an audience profile instead of guessing. Certificate statistics are tracked separately.